Thursday, November 15, 2012

GeoNet, Open Data and Reward


On Wednesday 7 November 2012 GNS Science won the “Open Science” category at the New Zealand Open Source Awards 2012 (we also won the “Government” category for GeoNet Rapid, see Figure 1).

From Wikipedia:

“Open science is the umbrella term of the movement to make scientific research, data and dissemination accessible to all levels of an inquiring society, amateur or professional. It encompasses practices such as publishing open research, campaigning for open access, encouraging scientists to practice open notebook science, and generally making it easier to publish and communicate scientific knowledge.”

For GeoNet, Open Science is all about our Open Data policy, which was a founding principle of GeoNet and a very important factor in our success. This has allowed the rapid uptake of data and for third party websites to use GeoNet information in new and novel ways including websites with a regional focus (such as Canterbury Quake Live which started operation following the beginning of the Canterbury earthquake sequence in 2010).

Figure 1: The GNS Science (GeoNet) Open Source awards 2012. Left is the award for GeoNet  Rapid in the  "Open Source use in Government" category and on the right the "National eScience Infrastructure Open Science" award for the GeoNet Data Policy and Services.
Many New Zealander’s reading this will remember the “user pays” phase of our development starting in the late 1970s, accelerating through the1980s and 1990s, and continuing into the 2000s. During this period it was government policy that all data and information had an immediate intrinsic value and this must be paid by the “end user”. The result of this was the drastic drop in the use of many data sources, and the trend for policy and decision making to become “data free zones”. 

When GeoNet began operation in 2001, the concept of Open Data was very unusual in New Zealand. Therefore, the fact that it was included as a requirement in the contract between the Earthquake Commission (EQC) and GNS Science was revolutionary, and one of several ground-breaking features of the arrangements between the two organisations. EQC insisting on an Open Data policy is yet another demonstration of how visionary and forward thinking the management and Board of EQC were at the time (and continue to be) with their support of  GeoNet and its part in New Zealand's geological hazards mitigation strategy. What if the Canterbury earthquakes had occurred before the establishment of GeoNet when there was only one real-time seismic sensor in the whole of Canterbury?

There has been a huge change in the last decade, and now most institutions in New Zealand (and internationally) accept the value proposition that Open Data is important for the advancement of science and the overall goals of New Zealand society (and GeoNet now has over 600 sensor network sites). We live in a beautiful but geologically active land. In our naturally active environment, the GeoNet Open Data policy has quickly led to a better understanding of the perils we face and the mitigation measures required.

For example, following the destructive Christchurch Earthquake of 22 February 2011 the openly available GeoNet strong ground shaking data was crucial to the understanding of the levels of damage and what changes were needed in the building codes before reconstruction began.The observed level of damage was greater than expected from a moderate sized earthquake, but the data were available to demonstrate the very high energy (maximum shaking levels over twice the force of gravity) compared to the magnitude. Detailed earthquake source modelling was possible showing that the fault ruptured up to a shallow depth beneath the Christchurch central business district. GeoNet data are central to the publication of four Canterbury special issues of scientific journals, and features in numerous scientific papers and presentations at conferences, enriching our understanding of this important earthquake sequence.

So Open Data it is, and we are pleased that after 12 years the significance of the GeoNet Open Data policy is publically recognised - thanks to the New Zealand Open Source Awards!


Sunday, October 14, 2012

GeoNet and Tsunami - Part One


One of GeoNet’s roles is as science advisers to the Ministry of Civil Defence & Emergency Management (MCDEM) on tsunami response. Currently this is mainly confined to regional and distant source tsunami caused by earthquakes. So how do we carry out our role?

There are three major aspects of the role – data and information, expert advice and warning systems and international engagement. I will outline each of these in turn – in this blog I will just concentrate on the tsunami (sea level) gauge network.

As a part of GeoNet we operated a tsunami gauge network of 17 sites around New Zealand and on offshore islands. These sites have twin pressure sensors in the ocean to record sea height change. The network is operated in partnership with Land Information New Zealand (LINZ) with the GeoNet Earthquake Commission (EQC) contribution supporting the data communications and processing. All the data is made available to the international data centres, particularly the Pacific Tsunami Warning Centre, (PTWC) in Hawaii, as well as being available from the GeoNet website.

A question we are often asked is: do these sites provide warning? And the answer (I am a scientist after all!) is yes and no. Yes, the gauges on offshore islands will provide an hour or two warning of a tsunami “surges” heading for mainland New Zealand, and ones on the mainland coast will provide some warning for other parts of New Zealand. But a gauge very close to you will be no help to you for warning. Tsunami warning is very international so we rely on information from other countries gauges, and other countries rely on our gauges – particularly our cousins across the ditch (for non-Australians or New Zealanders, that is the Tasman Sea) who may be threatened by a large earthquake at the bottom of New Zealand’s South Island.

Another really important use for these tsunami gauges is the calibration of tsunami forecast models. Since the Indian Ocean Tsunami on Boxing Day 2004 there has been huge progress with models that forecast the likely impacts from earthquake caused tsunami once accurate information earthquake is available. This is particularly true for ocean basin wide tsunami, where the tsunami waves may travel for many hours before being a threat on a distant shore. If the likely impacts can be forecast in advance then effective evacuation is possible without the economic losses of over evacuation or the issues caused if people are asked too often to evacuate but no tsunami occurs (the “cry wolf” affect).

Figure 1: Recordings of the Japanese Tsunami around the New Zealand Coast on the LINZ GeoNet Tsunami Gauge sites. Note the largest surges at Gisborne and the Chatham Islands are four to six hours after the first arrivals.
Recent Pacific Ocean basin wide tsunami have provide a rich data source for refining tsunami models. For example, the Japanese tsunami of 11 March 2011 was well recorded around the New Zealand coast (see Figure 1) with surge heights of around a metre in places. These measured values were very close to the forecast levels and increase our confidence that we can effectively warn New Zealand communities without closing the whole New Zealand coast. Figure 1 also demonstrates a really important observation – tsunami surges from distant tsunami just keep coming. In Gisborne and the Chatham Islands the largest surges occurred many hours after the first arrivals. If you cannot see the shark any more it may be safe to go back in the water (see Jaws if you don't understand the reference), but with tsunami take extra care for many hours after you see the first rise and fall of the sea.

In my next tsunami blog I will go into more detail about how we use the data and information and expert advice to advise on likely tsunami impacts.

Monday, September 17, 2012

Felt Intensity – What You Feel is What You Get!

How do we size an earthquake?

A few earthquakes over the last few months have got me thinking about how we talk about earthquake size. In the western world we are quite focused on magnitude, but that only gives a starting point. I have already bored you enough about earthquake magnitude in a few previous blogs (see What’s the Magnitude?; Deep Earthquakes and Magnitudes; and Deep Earthquakes and Magnitude – Again!) – but to recap, an earthquake magnitude is an estimate of the true size of an earthquake independent of the observer (or where the observer is). The magnitude is only the start of the story if you want to understand the likely impacts of an earthquake. Not all earthquakes are created equal; some are more energetic than others even if they have the same magnitude. Some direct shaking energy towards where people live, and where you are compared to the earthquake source is very important. All this leads to the idea of shaking intensity – a mapping of the levels of shaking caused by an earthquake rather than a single number like magnitude.


Modified Mercalli Shaking Intensity
  
If you want to characterise how you feel an earthquake, then felt intensity is what you are after. This is a measure of the shaking where you are, and is given (at least in New Zealand) by the Modified Mercalli (MM) scale which covers the range from not felt (MM 1: Imperceptible) to complete destruction (MM 12: Completely devastating). Obviously an earthquake’s impact and the level of damage it causes are related to the intensity. The MM value at a particular place depends on the distance from the earthquake, its size and depth, the kind of rocks between you and the source and material you or the building you are in rests on.

ShakeMap (or where did the map go?)

On the old GeoNet website we had a display on the front page based on the shaking at each recording station (Figure 1). Although this gave a good indication of the where maximum shaking levels were being recorded by our instruments (and I know some of you want it back!), it could be biased by instrument issues and was often misinterpreted. So it was good for a quick look, but not really very useful for characterising the potential damage in detail.
Figure 1: The "ShakeNZ" plot for the Christchurch  Earthquake  of 22 February 2011. This map shows the shaking  levels as squares around the sensor sites which change colour and get larger as the shaking level increases.
We are working towards having a ShakeMap (as developed by the United States Geological Survey, see the USGS Shakemap site) available for larger earthquakes which will indicate the distribution of shaking (see Figure 2 for an example). This map will be produced within a few minutes of an earthquake occurring and be based on data from the sensor sites and a knowledge of how the earthquake waves travel through the Earth (tailored for New Zealand conditions). The map will show MM intensity but we will also be able to provide information in forms that are suitable for use by engineers interested in the level of shaking experienced by buildings or other structures in the region. This can include shaking accelerations at different periods of oscillation – different size structures are more susceptible to different shaking oscillations caused by earthquakes.

Current planning should see ShakeMap on the new GeoNet website within the next few months.

Figure 2: An example ShakeMap for the Christchurch Earthquake of 22 February 2011. This is  an example of what the ShakeMap on the new GeoNet website may look like.
So what about shaking duration?

This is a hard one as the perceived duration will depend both on the size of the earthquake and where you are (a bit like intensity) but is also very dependent on the near surface structure under your feet. For example, if you live in a valley the shaking waves will “bounce around” in the valley and the shaking will go on for much longer than if you were on a hard rock site. We can estimate how long the fault takes to rupture (by studying the earthquake waves recorded on our instruments), but how long the Earth shakes depends on the size and distance, and how many ways the earthquake waves reach you (some waves “bounce” around in the Earth so the shaking goes on much longer than the fault break time). For these reasons we do not usually use duration as a measure of earthquake size.

To put this in terms of recent experience the fault-break of the Christchurch Earthquake (22 February 2011) was over in just a few seconds, but the shaking went on longer because of the near-surface structure under the city. But the total duration in areas of maximum damage was only around 10 - 15 seconds. Compare that to a possible Alpine Fault earthquake much further away from Christchurch where the shaking intensity would be much less in the city (in fact even much less than the Darfield Earthquake of 4 September 2010) but the shaking would go on for minutes. Duration is not a good indication of likely earthquake impacts. 

Sunday, September 9, 2012

GeoNet – Past, Present and Future


GeoNet needs your input …. But first some background:

Why do we need GeoNet?

New Zealanders live on the edge - astride the Pacific-Australia plate boundary, a part of the Pacific “Ring of Fire”. The level of earthquake hazard in New Zealand is similar to that of California and most communities have some exposure to this hazard. Additionally there is a significant volcanic hazard, both from the cone and caldera volcanoes of the central North Island and the volcanic field underlying its largest city, Auckland. Throughout New Zealand, landslides may be triggered by extreme weather or earthquakes, and the coastal areas are prone to tsunami, both from distant and local sources.

The case for GeoNet

In 2000 at the invitation of the New Zealand Earthquake Commission (EQC), GNS Science proposed the establishment of GeoNet, a geological hazards monitoring system. GeoNet would facilitate the detection, data gathering and rapid response to New Zealand earthquakes, volcanic activity, landslides, tsunami and the slow deformation that precedes or follows large earthquakes. This followed more than five years of equipment trials, capability reviews and widening concern about national geophysical infrastructure, the purpose and renewal of which had been largely overlooked during a major restructuring of the Government science sector in the early 1990s.

EQC launched GeoNet in 2001 through its research and education programme. In partnership with Land Information New Zealand (LINZ) and the Department of Conservation, EQC’s long-term support and direction of GeoNet has facilitated the creation of world-class capabilities.  GeoNet now has sensor networks throughout New Zealand (over 550 sites), distributed data collection, processing and distribution capabilities and a programme of continual improvement. In 2009, EQC renewed its commitment to GeoNet for a further decade, with the strategic focus shifting from delivery of minimum geographic coverage, to more sophisticated management of data and information to meet evolving user needs.

The GeoNet Review

Every four years an international strategic review of GeoNet is conducted to ensure its performance and map future directions and the next one will take place in late October this year. Earlier reviews took place in 2004 and 2008.

Since the 2008 review, the earthquakes in Canterbury have provided an extreme test of all GeoNet systems.  It is therefore timely to consider how GeoNet might be enhanced or extended to maximise the value of investment in the system.  This contemplates wider use of the collected information beyond the core geological hazards area.  For example, the current networks could be adapted to support country-wide, high-accuracy real-time positioning applications for many different sectors.

GeoNet Needs Your Input ….

If you regularly use GeoNet data and information for your work or analysis, or have used GeoNet data in a major project, we want to hear about it.  For example, we are aware that many people have used GeoNet strong-motion data in the analysis of the impacts of the Canterbury earthquakes and in published research papers, but the source of the data has not always been attributed, so it is hard for us to identify all related work without your help.

We are particularly keen to hear how GeoNet might be significantly improved in future. Please submit brief (maximum one page) summaries on either or both of these topics as soon as possible, not later than  21 September to geonet-review@gns.cri.nz.Your experience and ideas will inform the planning and direction for the next few years, so please help make a difference. 

Sunday, July 8, 2012

Deep Earthquakes and Magnitude – Again!


The recent large earthquake in the Taranaki Bight was an excellent example of the kind of event I discussed in a previous blog – deep and widely felt. It was felt strongly in places far away from where it occurred, and demonstrates the usual confusion between felt intensity, local magnitude and more modern measures of earthquake size.

The Local (Richter) magnitude 7.0 earthquake occurred at 10:36 pm on Tuesday 4 July (New Zealand Standard Time) about  60 km south of Opunake (out to sea) at a depth of about 230 km. The main details of the earthquake and its relationship to other events are covered by a newsstory on the GeoNet website. This earthquake was very widely felt in New Zealand - from almost the top of the North Island to the bottom of the South Island. But if you look at the distribution of felt reports (see Figure 1) it was most strongly felt along and up the subducted plate from the epicentre. As I explained in a previous blog this is because the energy from the earthquake travels up the plate rather than directly to the Earth's surface. It is also interesting how many people in the Canterbury region reported feeling the earthquake quite strongly. This is again because the tectonic plate "guides" the earthquake energy down the East Coast of New Zealand - it is not unusual to have deep earthquakes under the North Island felt in Christchurch but not directly above where they occur!

Figure 1: The pattern of the more than 6000 felt reports received on www.geonet.org.nz (the new GeoNet Rapid Beta site recorded a similar number) for the deep M7.0 earthquake of 3 July 2012
This earthquake again demonstrates how this "guiding" of earthquake energy causes our New Zealand Local Magnitude (used by the current GeoNet website) to overestimate the magnitude compared to international estimates. The earthquake "feels" larger to most New Zealanders than it actually is! For example, the United States Geological Survey (USGS) recorded this as a M6.2 earthquake, the GeoNet Rapid (Beta) site estimated the magnitude at M6.5, while our own estimate for the Moment Magnitude was M6.3. Who is right? The last three numbers quoted (6.2, 6.5, 6.3) are all basically estimates of Moment Magnitude which is based on the actual source characteristics of the earthquake. In an ideal world all these would give that same value, but this range of values is reasonably normal. The Local Magnitude is known to be about 0.5 magnitude units high for deep earthquakes (because of the effect described above), so all these values are about what we would expect. If we were currently using GeoNet Rapid as the official site (we will be from early September) the earthquake would have been reported as a M6.5.

This large overestimation of magnitude does not occur for shallower earthquakes, although estimates of magnitude from different systems will show some variation. For example, a recent earthquake west of Christchurch (Friday, July 6 2012 at 3:29 pm NZST) was assigned a magnitude of M4.8 by both our current GeoNet systems and the USGS and M4.9 by GeoNet Rapid (Beta). However, another deep earthquake on Saturday, July 7 2012 at 12:50 pm NZST again shows the deep earthquake effect, with GeoNet Rapid (Beta) giving it a magnitude of M5.2 compared to M5.7 for our current system.

This event also demonstrates the speed of GeoNet Rapid. The first location appeared in 1 minute 27 seconds (although at that stage the magnitude estimate was less than M6), and the magnitude "stabilised" at M6.5 in less than 2 minutes 30 seconds. Knowing the depth and location for a large offshore earthquake that quickly is very useful - it immediately tells us that no tsunami will be generated (the earthquake is too far below the sea bed). In fact many people will have had access to the location before the shaking was over!


Sunday, May 27, 2012

GeoNet and the Art of Earthquake Location Part 2


In my previous blog I discussing the principles of earthquake location, but we also have some reasonably difficult practical issues. The most important of these is how to identify the arrival of the earthquake waves when there are many sources of ground shaking. These include the background actions of the oceans on the shores, weather noise (such as wind, rain, thunder, etc.) and humans and other animals (see Figure 1). In fact it is what we call “cultural noise” which causes us the most difficulty. This is the noise us humans make going about our everyday lives (vehicles, factories, and just people walking around). This is obviously worse in cities where there are many of us causing ground noise. To avoid this many of our recording sites are as far away from people as possible! Another GeoNet blog (see GeoNet – Shaken not stirred) gives a very good example of seismic noise made by a large group of people. For all these reasons considerable skill is required to “pick” the first arriving earthquake waves which may be buried in ground shaking noise. Moving this to an automated process is difficult, but good progress has been made.  Machines now do the job more consistently than humans, but can still more easily be fooled by noise.


Figure 1: The GeoNet seismograph station near Denniston on the west coast of the South Island. The image shows two earthquakes near the centre, but also a lot of "cultural" noise. This site is prone to disturbance by nearby mining operations, which show as small, similarly-sized blobs during usual working hours.

An additional practical problem is making sure the correct earthquake arrivals are associated with the correct earthquake. In New Zealand where more than 20,000 earthquakes are located each year there are often earthquakes happening at the same time in different parts of the country. If the automatic processing mixes the arrivals from one earthquake with another event the calculated location will be inaccurate. To avoid this the computer is actually making 100s of estimates every second seeing if a “picked” phase arrival will fit any earthquake location. In this process an earthquake location needs to have a good level of accuracy before it is accepted. But some bad events do get through when there is a large amount of ground noise or signals from distant earthquakes are mixed with nearby events.

Our new earthquake analysis system, GeoNetRapid (currently in Beta) is based on the SeisComP3 system developed by GFZ in Potsdam, Germany which is made freely available and has a large and active user community (for details see my colleague’s blog). This system automatically identifies earthquake wave arrival times (phases), associates the phase into earthquake events and then provides a location and depth with error estimates (and magnitude estimates). Additionally, within GeoNet Rapid we are using many decades of earthquake and tectonic research in New Zealand in the form of a three dimensional model of how earthquake wave speeds vary around New Zealand. This allows for the more accurate estimation of the true location and depth of earthquakes. But even with all this new technology the machines will sometimes get it wrong. For larger felt earthquakes recorded on many stations this is now rare and will continue to improve as we refine GeoNet Rapid. For more details on how to use GeoNet Rapid see GeoNet Rapid - Why is it different?

Links
How do seismologists locate an earthquake?
Foo Fighters rocked Auckland!
GeoNet Rapid (the Beta website)
The SeisComP3 earthquake Analysis System (the heart of GeoNet Rapid)
GeoNet Rapid - Being Faster
GeoNet Rapid - Why is it different?

Sunday, May 13, 2012

GeoNet and the Art of Earthquake Location - Part 1


Using the recordings of earthquake waves at GeoNet stations and some simple mathematics we can easily calculate an earthquake’s location. Yeah Right! (non-New Zealanders should check here and Figure 1 to understand the above statements). Earthquakes are complicated ruptures of the rock within the Earth. We imagine them as simple fault breaks deep underground, usually showing as nice straight lines where they reach the Earth’s surface. This simple picture is far from what actually happens - most earthquakes do not break the Earth’s surface, and larger earthquakes usually rupture more than one fault. This is why asking “what fault was that earthquake on?” is usually the wrong question unless you are talking about a large earthquake. For example, only the Darfield (September 2010) earthquake in the Canterbury earthquake sequence caused an identifiable surface rupture. Using various kinds of land surveying (very accurate GPS and satellite radar mapping) and many recordings from ground shaking sensors we can build up a picture of the faults which ruptured in the major earthquakes in the sequence. What we have found is that each earthquake is actually made up of several fault breaks within the Earth.


Figure 1: Yeah right! Tui beer is promoted through a humorous advertising campaign which uses stereotypes, heavy irony and the phrase Yeah Right. This phrase has become a part of New Zealand culture.

Let’s look at the earthquake location process in a bit of detail, including an “Earthquakes 101”. When we talk about the location and depth of an earthquake we are actually referring to the place where the fault rupture starts and begins sending out earthquake waves. A very big earthquake can break a fault (or faults) 100s of kilometres long, but its location will be given as the point where it starts. Technically we refer to the point on the Earth’s surface above where the rupture starts (referred to as the focus or hypocentre) as the epicentre (or just the location). The earthquake’s focus will be some depth below the Earth’s surface directly below the epicentre (Figure 2).


Figure 2: Earthquake location terms. Image from “Earthquakes and Plates


The location process involves measuring the arrival time of the earthquake waves (referred to as phase arrivals or just phases) at our ground shaking sensors. There are two main types of earthquake waves, imaginatively called primary (P; see Figure 3) and secondary (S; see Figure 4) waves. P-waves are like sound waves which travel through the Earth and are much faster than S-waves, which could also be referred to as shaking waves as they cause a side to side motion. It is the S-waves that cause most earthquake damage. In the upper 10 km of the Earth’s crust P-waves travel at about 4.5 to 6.5 km per second and S-waves at 3 to 4 km per second. There are other kinds of earthquake waves which are a combination of the main wave types. The difference in arrival time between these two wave types indicates the distance from the earthquake to the recording station (a bit like counting the seconds between the lightning flash and the sound of thunder gives an estimate of how far you are from a storm).


Figure 3: A representation of how P-waves, which are compressional waves (like sound waves) travel through the Earth. Copyright 2004-10.  L. Braile.  Permission granted for reproduction and use of animations for non-commercial uses.


Figure 4: A representation of how S-waves, which are transverse waves travel through the Earth. Copyright 2004-10.  L. Braile.  Permission granted for reproduction and use of animations for non-commercial uses.

Calculating the location, depth and size of an earthquake would be much easier if the earth beneath our feet was uniform and composed of just one kind of rock. But the rocks are layered, made of a variety of rock types, are full of fractures and far from uniform. In fact because of the alignment of some rock crystals and cracks earthquake waves may travel at different speeds in different directions! So that simple mathematics I mentioned above (tongue in cheek) gets complicated very quickly. Usually we ignore all these complications and just assume the speed of earthquake waves only varies with depth within the Earth. This works reasonably well if the wave speeds only change a small amount from place to place, but New Zealand’s location on a tectonic plate boundary means that using the simple approach can introduce large errors. The earthquake location process uses the phase arrival times to calculate the position of the earthquake source in relation to all the stations which recorded the earthquake waves using the travel times and distances involved (the simple mathematics I talked of above, see here for a more detailed description). In general the more stations recording an earthquake the better the estimation of location and depth will be.  But also the most accurate locations are calculated when the recording stations surround the earthquake, and the poorest locations are when the earthquake occurs outside the sensor network (such as offshore). The long thin nature of New Zealand means recording stations often do not surround an earthquake’s location.

In my next blog I will talk about how we identify the P and S waves that are crucial to getting an earthquake location.


Monday, April 23, 2012

The Case for Building Instrumentation


Should more buildings in New Zealand be equipped with earthquake recording instruments to measure their response to shaking? GeoNet data have proven to be very important for understanding the extensive damage caused by the Canterbury earthquakes during the last 18 months. We can thank the vision of John Berrill, formerly of the Engineering School at the University of Canterbury, for the high level of GeoNet instrumentation in the Canterbury region (although the major target was recording  an Alpine Fault rupture; see "CanNet: the little network that could!” in GeoNet News October 2010). The many GeoNet strong motion stations provided a very good indication of the extreme levels of ground shaking caused by the major earthquakes (see Figure 1),  but only a single building in Christchurch had been instrumented in the GeoNet building instrumentation programme.  What would more instrumented buildings in the region have told us? Could they have identified buildings damaged in the Darfield (September 2010) earthquake and helped with post-event building evaluations? Could they be helping us make decisions about the rebuild process? Should future buildings over a certain size be instrumented to a specified level as is required in California? Can the one instrumented building in Christchurch provide an insight into the answer to these questions? I will give a little background and then come back to these questions.

Figure 1: The levels of shaking for the top six high impact Canterbury earthquakes. The length of the bars show the vertical and horizontal shaking levels at the indicated sites around the Christchurch area. The vertical shaking in the Christchurch (22 February 2011) Earthquake  exceeded 2 times the force of gravity, and a similar level of horizontal shaking occurred during the June 13 2011 earthquake.

I recently attended the annual conference of the New Zealand Society for Earthquake Engineering (NZSEE) at the University of Canterbury in Christchurch. The theme of the conference was "Implementing lessons learnt” from the Canterbury earthquakes.  The major Canterbury earthquakes were high impact events which inflicted higher than expected levels of damage. There are many reasons for this, the most important are:

  • the closeness of the earthquakes ruptures to Christchurch city;
  • the very high shaking levels;
  • the extensive liquefaction.
Many of the papers presented at the NZSEE conference used GeoNet data as the basis for their analysis (although with limited acknowledgement of GeoNet and its sponsors – the Earthquake Commission (EQC), Land Information NewZealand (LINZ) and GNS Science). What is clear is that much of the damage would have been very difficult to understand and explain without the availability of the GeoNet data showing the actual level of ground shaking. Without data it is very difficult to match expected and actual levels of damage.

It is a common misconception that the aim of our current building codes is to ensure buildings are not damaged by major earthquakes. It is not - the aim is to ensure life safety. Buildings that perform well and save lives may still need to be demolished and replaced following a major earthquake. Critical buildings such as hospitals are built to higher standards, and one way this is done is by using base isolation so the building does not respond as violently to the ground shaking.  Base isolation and other means of shaking energy absorption appear to be very effective at reducing the level of damage, although very few (around a dozen) buildings have base isolation in New Zealand.  Papers presented at the conference suggested the additional cost of base isolation is usually less than 10%.

The GeoNetBuilding Instrumentation Programme (see Figure 2) aims to install multiple seismic instruments in about 30 representative buildings (commercial and residential) and bridges throughout New Zealand to gain insights into the earthquake engineering performance of those structures. To date 10 installations have been completed and several others are in progress. A brochure on the programme can be found here. The list of buildings are chosen to cover the range of building types and were identified largely on the likelihood of capturing useable data, so most are in Wellington or along the east coast of the North Island. There were some planned for the South Island but originally very few for Christchurch.

Figure 2: A typical schematic representation of the components of the seismic instrumentation deployed within a building. The sensors are distributed at various levels of the building and connected through computer network cables to the central recording unit. The GPS receiver provides accurate timing (to less than 1 ms). Wherever possible, one of the sensors is mounted in an enclosure a short distance from the building so as to record shaking levels away from the building. Diagram courtesy of Canterbury Seismic Instruments Ltd.
What is clear is that without instruments in buildings it will always be impossible to know if the damage caused by past large earthquake could have been identified using such instruments. For example, we will never know if some damage could have been detected instrumentally after the Darfield earthquake and before the Christchurch earthquake. The two major changes which could be identified are inter-story drift (floors moving horizontally, relative to each other) and the frequency of the modes of oscillation of a building. Research is needed to identify how much use building instrumentation would be and how the data from instrumented buildings can best be used to detect what has come to be known as “building health”. But in my opinion we should be instrumenting as many buildings as possible, and perhaps there should be a minimum instrumentation standard for buildings of a given size or complexity. It seems like an oversight that few base isolated buildings are currently instrumented. Based on the usefulness of the ground-based GeoNet data for the understanding of the Canterbury earthquakes, how much more could have been added if a selection of the most damaged buildings in central Christchurch had also been instrumented before the earthquakes occurred?

Links:
GeoNet Website
GeoNet Rapid (Beta)
GNS Science
Earthquake Commission
Land Information New Zealand
GeoNet News, Special Darfield Earthquake issue, October 2010
New Zealand Society for Earthquake Engineering
NZSEE 2012 Conference
GeoNet Building Instrumentation Programme
GeoNet Building Instrumentation Programme Brochure

Wednesday, April 4, 2012

GeoNet Rapid - Why Now?


One of the obvious questions to ask about the launch of GeoNet Rapid (Beta) is - why now? Why didn’t we have it before the Canterbury earthquakes began? There are three factors to consider when answering these questions: the coverage of the GeoNet sensor networks, the rapid development of the systems and technology used to locate earthquakes and the long thin and plate boundary nature of New Zealand. GeoNet Rapid is the “tip of the iceberg”, and relies on an extensive sensor network throughout New Zealand, a real-time data communications network (like a private version of the Internet), a high technology earthquake analysis system and a state-of-the-art information delivery system.

To explain this a bit more let’s look at the evolution of GeoNet by traveling back a decade or so in time to before GeoNet existed (see Figure 1). Back then there were just four real-time earthquake recording stations, two radio networks and a small number of "dial-up" stations in the whole of New Zealand. The rest of the stations (the small black squares) recorded on cassette tapes and paper printouts which were mailed in weekly for processing. In the best case it would take an hour to get an approximate earthquake location, and weeks to months to get a “final” location. Sometimes we needed to ring up the local farmer who would read off earthquake data from the printouts! Estimates of shaking intensity from the (film recording) strong shaking instruments took up to a year to become available.


Figure 1: The Pilot network existing before the start of GeoNet in July 2001
(diagram from the original GeoNet proposal dated 16 March 2000)

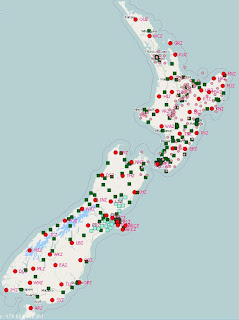
Contrast that situation with the current GeoNet network (see Figure 2) which has more than 550 sensor sites and real-time (or near real-time) data communications. The GeoNet sensor network grew from almost nothing to its current size over the decade following the launch of GeoNet in 2001, but only in the last few years has it been at the size and density required to give reliable automatic earthquake locations. GeoNet was developed as a long term sustainable system and much of the effort in the first decade went into the development of the sensor networks, and it was only when they were in place that GeoNet Rapid became feasible.


Figure 2: The current GeoNet sensor network - to prevent
clutter only the earthquake recorders are shown.
For more information about the GeoNet network see
http://www.geonet.org.nz/resources/network/netmap.html

Locating an earthquake and estimating its depth and magnitude  is a complex process involving many calculations once the earthquake shaking waves arrive and are measured at a minimum number of sites (I will cover this in more detail in a later blog). Although the theory of earthquake analysis has not changed greatly, the available systems and technology have developed considerably in the last decade, receiving an extra boost following the Indian Ocean tsunami at the end of 2004. This has greatly improved the availability of software for the rapid characterisation of earthquakes. There have also been big advances in the ability to feed this information quickly to websites (and as you are now seeing to mobile devices).

New Zealand is not an easy place to locate earthquakes because it is a country made up of two long thin islands. It lies on the plate boundary between the Pacific and Australian plates and experiences many shallow and deep earthquakes. To locate an earthquake it must be almost surrounded by earthquake recorders - hard to achieve in many parts of New Zealand. A very effective earthquake recording network for New Zealand would have many offshore (undersea) instruments costing many times the current resources of GeoNet.

So GeoNet Rapid was not possible until the GeoNet sensor network was near completion and the world had made the fast advances in technology in the last few years. Even with the current network and technology earthquakes in some parts of New Zealand (where there are fewer stations) and those offshore will sometimes be mis-located and need seismologist intervention. GeoNet Rapid (Beta) can now, in most cases, produce good locations very quickly, but will still sometimes give less reliable estimates. We are working to improve this as we move through the beta process to the final release later this year.

Wednesday, March 21, 2012

Deep Earthquakes and Magnitudes


Let’s just have one more look at magnitude before moving on to other topics. Some people have noticed that the magnitudes being given for deep earthquakes under the North Island by GeoNet Rapid (Beta) are much lower than the official Local Magnitudes being given on www.geonet.org.nz. This is related to GeoNet Rapid (Beta) moving to magnitudes based on estimates of Moment Magnitude, as discussed in my last blog. It highlights why understanding earthquake magnitude can be complicated – particularly in New Zealand where we have deep earthquakes. The magnitude estimate used by GeoNet Rapid (Beta) is removing the bias in the Local Magnitude caused by the way the earthquake waves lose or do not lose energy as they travel through the complicated earth structure beneath the North Island. To understand this let’s look in a little detail at what lies below our feet (assuming you live in the North Island as I do).

Under the North Island of New Zealand the Pacific and Australian tectonic plates are colliding, and the Pacific plate is being pushed down (subducted) under the Australian plate (for more details see article in Te Ara). It is a slow collision compared to a car crash at only around 5 cm a year, but reasonably fast in geological terms. This can be seen in the image of earthquakes under the North Island of New Zealand (see diagram) – shallower earthquakes (orange) near the east coast give way to deeper earthquakes (green, blues to purple) as we travel west outlining the Pacific plate getting deeper beneath the Australian plate. By the Taranaki area the earthquakes are hundreds of kilometres deep and by Auckland you have moved out of the region where there is a subducting Pacific slab at depth. Above the Pacific plate under much of the central North Island, the material has been disturbed by this collision and subduction process forming a region of volcanic and geothermal activity.


When an earthquake happens deep under the North Island the earthquake waves travel up and along the colder rock of the Pacific plate without losing much shaking energy, but the waves travelling up through the hotter volcanic zone lose most of their shaking energy. This explains why these earthquakes are often strongly felt on the East Coast of the island but are sometimes not even felt directly above where they occur! Putting all this together we see why measuring the magnitude of a deep North Island earthquake is difficult. Our instruments record high levels of shaking along the East Coast of the North Island and even felt levels of shaking along the same coast in the South Island, but low levels of shaking directly above the earthquake and to the west (depending on the location).

When the New Zealand Local Magnitude scale was devised in the 1970s, these complications were not taken into account fully and so deep earthquakes under the North Island are assigned higher magnitudes than newer techniques like Moment Magnitude give. This explains why GeoNet Rapid (Beta) which uses a magnitude estimate based on Moment Magnitude gives values lower than Local Magnitude for deeper North Island earthquakes by around 0.5 units or more. Similar effects happen for deep earthquakes in the Fiordland region of the South Island.

Saturday, March 17, 2012

What’s the Magnitude?

And whose Magnitude is it anyway?

With the introduction of GeoNet Rapid (our new automated earthquake analysis system - http://beta.geonet.org.nzwe have began the move to a unified magnitude estimate (Summary Magnitude, or just M) based on Moment Magnitude. Moment Magnitude is more closely based on the full earthquake characteristics, and will align better with the magnitudes given by international institutions such as the United States Geological Survey (USGS).

Was that a magnitude 4.8 or 5.3? That earthquake felt much larger than the one last week but GeoNet says it was ONLY a magnitude 4.8! And why has the magnitude now gone up? These are the questions we are asked all the time. And once we move to GeoNet Rapid I am sure even more questions will come our way.

For example, on the last day of December 2011 a (GeoNet) magnitude 4.8 earthquake occurred at 1:44 in the afternoon about 10 km east of Christchurch. The USGS calculated it was magnitude 5.3. Who was right? The media suggested the USGS was (see http://www.stuff.co.nz/the-press/news/christchurch-earthquake-2011/6206867/Aftershock-may-be-one-of-biggest), and several people in Christchurch agreed saying that it felt much bigger than 4.8. As stated in the article the USGS usually gives lower magnitudes than GeoNet, but in this case they did not because they used a different magnitude method than usual. Independent estimates using Moment Magnitude gave a value a little lower than GeoNet as expected.

I repeat this story here to show the trap of using magnitude as a measure of earthquake size without knowing the detail. Currently GeoNet publishes Local Magnitude (sometimes called Richter Magnitude after its inventor, Charles Richter) for most earthquakes but uses Moment Magnitude for large (usually greater than around magnitude 6) earthquakes because local magnitude is unreliable for larger events.

The magnitudes of earthquakes cause much confusion, with different organisations publishing different values for the same earthquake. And often more data results in the magnitude being revised up or down.

It does not help that there are more different magnitude methods than I have fingers! Or that it is not possible to sum up the size of a complicated natural phenomenon like an earthquake with a single number.

We describe an earthquake as happening at a place (the epicentre), at a distance below the Earth’s surface (depth), and having a size (magnitude). Real earthquakes start breaking the rock somewhere “down there”, and continuing to rupture for a time in a particular direction (or in more than one direction). To fully describe an earthquake requires many numbers rather than the three listed above. So why do we use magnitude?

Magnitude is an estimate of the size of an earthquake independent of the location of the person experiencing it (l'll talk some more about felt intensity in a later blog). Originally magnitude was based on the size of the traces on a particular type of earthquake drum (the Wood-Anderson seismograph). And this is still how Local Magnitude is calculated (although now computers transform modern seismograph signals into “pretend” Wood-Anderson instruments before the measurement is made). The values we give are an average of many measurements on many drums and are accurate to about one decimal place (for example 4.1) although the average usually has many decimal places. Most countries have developed their own Local Magnitude estimations.

Over the years scientists have developed other magnitude methods for particular uses. Probably the most useful of these is Moment Magnitude which is based on the actual earthquake source dimensions and properties. To fully characterise the Moment of an earthquake takes many numbers, but these are then reduced to the one number – the Moment Magnitude. There are always downsides, and in the case of Moment Magnitude it takes longer to calculate (because you have to wait for more data to arrive), and it cannot be calculated for smaller earthquakes (much below about magnitude 4).

The way around this is to use Local Magnitude as the preferred estimate for magnitude for smaller earthquakes and a quickly calculated estimate of Moment Magnitude for larger ones. This is what GeoNet Rapid will provide using Summary Magnitudes (or just M) based on this idea. It is not as simple as that because the scales need to mesh together, be consistent with previous methods, so over time we will be making refinements as the new system develops. And we will be working with USGS to get consistency with them, but be warned - magnitude is an estimate and it is rare for two institutions to give exactly the same value for an earthquake. Within 0.1 is the best we can expect.