Tuesday, December 3, 2013

GeoNet 2023 Part 2: The here and now

Before launching into what GeoNet may look like in 2023, I will briefly review where we are at now and try to answer the question – is the past a good predictor of the future?

What is GeoNet?
GeoNet is New Zealand’s geological hazards monitoring system – we monitor earthquakes, volcanic activity, tsunami and land stability. As well as monitoring these hazards, GeoNet collects high quality data for research which will lead to better knowledge and therefore mitigation of our geological hazards.

GeoNet can also be viewed as a large, distributed data collection, processing, archiving and delivery system. It is comprised of sensors networks, processing and archiving capability, and data and information delivery functions.

And yet another way to look at GeoNet – it is a New Zealand high technology project that made good!

GeoNet networks ….
GeoNet operates a network of over 600 sensor sites throughout New Zealand, connected by a variety of data communication systems (satellite, radio, landline and mobile) which form a huge computer network. The approximate breakdown of sensor types is:

  • 180 “weak motion” earthquake recorders (both National and Regional networks of sensors) to locate earthquakes
  • 180 continuous GPS sites which record how the land deforms slowly and during earthquakes
  • 250+ “strong motion” sensors which record the shaking levels in felt earthquakes, including sensors in buildings and on bridges
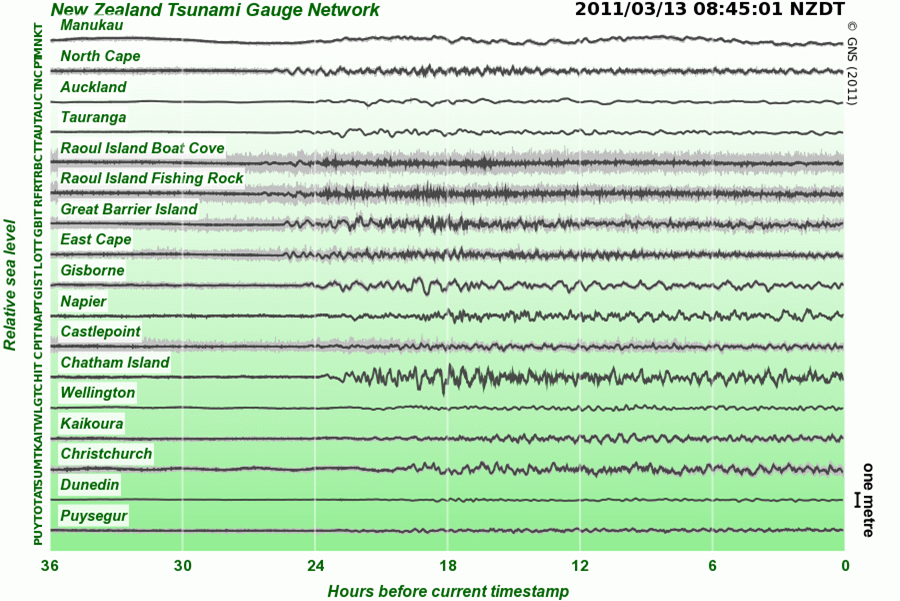
  • 17 tsunami gauge sites to record sea level change caused by tsunami
  • Plus a variety of other sensors to record position, chemistry, water levels and temperatures for volcano and landslide monitoring
The big changes in the GeoNet sensor networks have been in the way we move data around the country. The fundamentals of the sensor and data recording technology have not changed much, but with the spread of the Internet our ability of moving data has grown. In 2001 many places required expensive satellite data communications, but this situation is improving fast. The spread of the Internet was predictable and has paralleled the growth of GeoNet.

GeoNet data ….
The data from the sensor networks feeds into GeoNet’s distributed data centre system. When GeoNet began in July 2001 our plan was to have a main data centre in Wellington with a backup site at GNS Science’s Wairakei campus near Taupo. Over the last few years we have moved away from that concept to a distributed data centre model using compute capacity and storage in external and internal “clouds”. GeoNet now operates around 100 “virtual computers” which are centrally configured and managed allowing fast rollout and quick failure replacement. GeoNet Rapid, which automatically locates New Zealand’s earthquakes is run primarily in a cloud service in Auckland with the backup here in Wellington. The rapid availability and growth of the cloud is something I had not expected, but is now central to GeoNet operations.

In the early days of GeoNet we calculated that if computer hard disk space continued to increase at the (then) current rate, we could keep all data on-line indefinitely. Currently GeoNet collects around 8 GB a day and the total archive is around 30 TB. When GeoNet started, 30 TB of online storage required robotic tape changing systems costing millions of dollars. Now I have around 10 TB of storage at home - this is one technology prediction we got right!

Figure 1: GeoNet sensor network 2013 - Seismographs (big and small red dots); Strong motion (big and small green squares); GPS (black and light blue triangles); Tsunami gauges (upside-down dark blue triangles).

GeoNet outputs ….
The data and information produced by GeoNet is delivered through the GeoNet website, which is itself a distributed system of New Zealand and international computer servers. We also have information available via our smartphone Apps (currently on Android and iOS). Via the website, it is possible to find such things as earthquake information, volcano status and the position changes happening to our GPS stations as New Zealand slowly changes shape as we are buckled by the slow collision between the Pacific and Australian tectonic plates. Researchers can download data on earthquake shaking, the raw data used to measure the slow deformation as New Zealand deforms, and all the time-series data (waveforms) recorded by seismographs and strong motion instruments. All of the information on the sensor networks (sensor locations, types and calibrations, etc.) is available via the website so that the data can be interpreted and used correctly.

To demonstrate how the use of the GeoNet website has grown, lets look at the case of Dino the pink dinosaur. In the early days of GeoNet, Dino appeared in front of the White Island volcano-cam and caused the one and only complete outage of the website when "huge" numbers of admirers arrived to view him (or her?). Traffic to the site reached 10 hits per second! Today a widely felt earthquake drives traffic to 10s of thousands of hits per second.


So, is the past a good predictor of the future? Sometimes! The growth and development of GeoNet has paralleled that of the Internet and computer technology and will probably continue to do so. 

Next blog - GeoNet 2023 Part 3: The way ahead

Tuesday, November 19, 2013

GeoNet 2023 Part 1: Looking back to look forward

I was recently asked to take part in a “navel gazing” exercise as a part of the eResearch2020 project and it got me thinking about both where GeoNet has come from, but more importantly, where we are going over the next decade. What will be the big changes? Where will sensor and data processing be at in another 10 years? Is the past a good predictor of the future? So first let’s look back to look forward in this first part of a short blog series.

In the beginning ….
In 1982 I was employed to investigate the possibility of collecting all New Zealand’s seismograph data centrally and electronically in Wellington. In those days all earthquake recording required those rotating drums and needles that movie sets so love. And most of the recording was done onto film which needed developing before use. I quickly established that the cost of digitally recording and transmitting all of the data to Wellington would climb into the millions of dollars (and that was 1982 dollars!). That could have been the shortest job ever – but I am still working on GeoNet more than three decades later!

Going digital ….
The solution at the time (mid-1980s) was to “go digital” and record the earthquake data on magnetic tapes that were then posted to Wellington for analysis. So I worked on methods of identifying the earthquake signals in the background noise caused by the weather, people and other animals. We could only record 25 MBytes (yes you read that right, mega-bytes not giga-bytes!) on each tape so we had to “throw away” most of the recorded ground signals. The world moved slower in the 1980s, but by around 1990 most of the 30 or so earthquake recording sites around New Zealand had been converted to digital recording.

Figure 1: The EARSS (Equipment for the Automatic Recording of Seismic Signals) digital seismograph which recorded on 25 Mbytes tape cartridges. Software running on a microprocessor automatically detected earthquake signals and recorded segments of data to the tape. 

Fast earthquake location, 1990 style ….
At that stage the tapes were posted to us once a week by the local farmers meaning it could take up to a month to get all the data required to locate an earthquake. The short cut was to ring the farmers who would read off earthquake wave arrival times from a paper printout. Using that information and data from seismographs around the Wellington region, we would be able to (if luck was on our side and the farmers were at home) provide a rough location and size for a well recorded felt earthquake in about an hour. The height of technology and science at the time!

I have just checked - the last tape from those old “tape seismographs” was received and read in mid-2005, only a little over eight years ago. By then we had made the huge change to recording ground shaking continuously at our seismograph sites and transferring the data to our data centres almost instantly for analysis. For many years following 2005 our earthquake processing, although now much faster, still required manual intervention to achieve acceptable results. All locations sent to the GeoNet website were reviewed by a seismologist before publication – a process requiring about 20 minutes.

A new beginning ….
From the beginning of GeoNet in July 2001 we progressively replaced the tape seismographs,  added other sensor technologies and increasing the number of sensor sites from around 60 in 2001 to over 600 in 2012. Then in 2012 we introduced GeoNet Rapid with automatic earthquake processing and reporting including a blow-by-blow record of the “history” of the earthquake location process published directly to the GeoNet website.


Next blog - GeoNet 2023 Part 2: The here and now

Monday, January 7, 2013

GeoNet and Tsunami - Part Two


Introduction

In my last tsunami blog I outlined GeoNet’s role operating the real-time tsunami gauge (sea level) network, and the use of these gauges for tsunami modelling, characterisation and warning.

GNS Science does not operate an official warning centre, but are the science advisors (using the GeoNet capability) to the Ministry of Civil Defence & Emergency Management (MCDEM), the New Zealand agency responsible for tsunami warning. International and New Zealand data are used to characterise the potential of tsunami generated by distant or regional earthquakes to threaten the New Zealand coast.

Distant and Regional Source Tsunami

Distant source tsunami take many hours to reach New Zealand allowing adequate time for warning and evacuation if required. Regional tsunami sources have travel times of between one and three hours and usually originate from the South-west Pacific region. In this case although there is less time official warnings are still possible.  For both distant and regional source tsunami New Zealand relies on the Pacific Tsunami Warning Centre (PTWC), located in Hawaii to alert us to possible tsunami threats. PTWC serves as the operational headquarters for the Pacific Tsunami Warning and Mitigation System (PTWS). The PTWS is governed by Pacific member countries of the Intergovernmental Oceanographic Commission (IOC) which is a body under the United Nations Educational, Scientific and Cultural Organization (UNESCO). In a later blog I will outline how New Zealand contributes to PTWS.

The PTWC monitors an expansive seismic and sea level network (provided by member countries of PTWS) in the Pacific and issues tsunami bulletins which are used to trigger the New Zealand response. Once a notification is received from PTWC (via a variety of communications channels) the likelihood of serious impact in New Zealand can be assessed.  A brief consultation between the GeoNet and MCDEM Duty Officers takes place and this can lead to the issuing of either a “no threat”, “potential threat” or “warning” message. While a “warning” will be issued by MCDEM as a default action if an earthquake exceeds certain thresholds, in most cases no action is required because the event is too distant or small to be a danger to New Zealand. As a first response the GeoNet Duty Officer uses the best available information on the earthquake size and location and a catalogue of tsunami forecast models to quickly estimate the likely tsunami impact in pre-defined coastal zones around New Zealand (see Figure 1). This information is provided to MCDEM as a first estimate of the likely actions required by responding agencies.

If time permits, the GeoNet Duty Officer calls a meeting of the Tsunami Experts Panel to provide a more detailed estimate of the likely impacts on New Zealand. The panel is comprised of New Zealand experts from GNS Science, the National Institute of Water and Atmospheric Research (NIWA), New Zealand universities and private organisations. Extra observations and modelling techniques are employed by the Duty Officer and members of the Tsunami Experts Panel who give continuing updates to MCDEM on the probable impacts of the tsunami. As part of this process a Science Liaison Officer is provided to the National Crisis Management Centre (NCMC, located in the Beehive basement) if the centre has been activated. This provides a seamless connection for science advice to the emergency responders.  This process of review and update continues until the threat posed to New Zealand passes.

Figure 1: The tsunami threat level map produced at the time of the March 2011 Japan Tsunami. Note that the colours used for the threat levels have changed to avoid confusion with evacuation zones. For more details refer to the Tsunami Warning and Advisory Plan (page 13) on the MCDEM website.
Local Source Tsunami

What about local source tsunami warning? Here we mean tsunami with a travel time of less than one hour to the nearest coast. The greatest local source tsunami threat to New Zealand is from the subduction zone along the East Coast of the North Island, where the Pacific and Australian plates meet. This could potentially cause a huge tsunami similar to the one that struck Japan in 2011, but unlike Japan we have very little indication that such a tsunami has ever occurred.

 New Zealand does not have a dedicated local tsunami warning capability.  While MCDEM will issue warnings in the same manner as described above in the case of a nearby large earthquake, these warnings are unlikely to be timely enough for effective response so it is important people know the natural warning signs and act on those. Examples from Indonesia, Samoa, Chile and Japan suggest that people are much more likely to survive a tsunami if they heed the natural warning signs and self-evacuate. Waiting for an official warning often means losing those vital few minutes with fatal results.

So, people in coastal areas should watch out for:
  • strong earthquake shaking (hard to stand up);
  • weak earthquake shaking lasting for a minute or more;
  • strange sea behaviour such as the sea level suddenly rising and falling, or the sea making loud and unusual noises or roaring like a jet engine.
If any or all of these are observed – don’t wait for an official warning – let the natural signs be the warning. Take immediate action to evacuate the predetermined evacuation zones, or if they don’t exist go to high ground or go inland (both is best).

It is important to note that the hardware to provide a dedicated local tsunami early warning system, even when fully developed only provides a small part of what is required for a robust, sustainable, end-to-end local tsunami early warning capability. The warning messages need to reach the community at risk and the community must have pre-planned response procedures if effective local tsunami warning is to succeed. And this must be sustained for decades. Additionally, it is important that any warning system not undermine self-evacuation (mentioned above as so important) triggered by natural warning signs. Education is a cornerstone of a sustained tsunami risk awareness and response programme.

GeoNet and Local Tsunami Early Warning

By its nature GeoNet does have some of the tools required to provide local tsunami early warnings, including a broadband seismograph network, a tsunami gauge (sea level) network, expert staff and access to international data feeds. However, several components required for a robust local warning capability are lacking. For example, New Zealand currently has no offshore deep sea tsunami detection capability, and relies on other countries’ sensors. And further developments of the earthquake systems are required:

  • Improved offshore earthquake location capability. Because of the long thin nature of New Zealand earthquake location and depth estimation accuracy drops off quickly for offshore events;
  • Improved earthquake size (magnitude) estimation (using both seismic and GPS techniques);
  • Fast earthquake source characterisation – is it the kind of earthquake which may cause a tsunami?;
  • Tsunami (slow source) earthquake identification capability – is an earthquake of the kind that appear to be smaller but can cause large tsunami?

These capabilities are being researched or are under development but not yet available. Even with all these capabilities, I believe an effective local tsunami early warning system would require at least some offshore deep ocean sensors off the East Coast of the North Island. This would provide good capability for that region (the most destructive of the possible local sources), with capabilities in other regions mainly limited to warnings based only on earthquake size, depth and location. A further requirement of an effective local tsunami early warning system is a fully staffed 24/7 operations centre. GeoNet Duty Officers are currently “on-call” and can respond from home or work, but are not full time in the role. Automation can be employed as much as possible, but with current and envisaged levels of technology all countries attempting local tsunami early warning have 24/7 staffed operations centres. 

The bottom line is that GeoNet could play a small but significant part in the national effort to establish a fully operational and effective local tsunami warning capability. But an extra zero would need to be added to the GeoNet budget if this were to become a reality, and a coordinated effort by many New Zealand organisations would be required.


Thursday, November 15, 2012

GeoNet, Open Data and Reward


On Wednesday 7 November 2012 GNS Science won the “Open Science” category at the New Zealand Open Source Awards 2012 (we also won the “Government” category for GeoNet Rapid, see Figure 1).

From Wikipedia:

“Open science is the umbrella term of the movement to make scientific research, data and dissemination accessible to all levels of an inquiring society, amateur or professional. It encompasses practices such as publishing open research, campaigning for open access, encouraging scientists to practice open notebook science, and generally making it easier to publish and communicate scientific knowledge.”

For GeoNet, Open Science is all about our Open Data policy, which was a founding principle of GeoNet and a very important factor in our success. This has allowed the rapid uptake of data and for third party websites to use GeoNet information in new and novel ways including websites with a regional focus (such as Canterbury Quake Live which started operation following the beginning of the Canterbury earthquake sequence in 2010).

Figure 1: The GNS Science (GeoNet) Open Source awards 2012. Left is the award for GeoNet  Rapid in the  "Open Source use in Government" category and on the right the "National eScience Infrastructure Open Science" award for the GeoNet Data Policy and Services.
Many New Zealander’s reading this will remember the “user pays” phase of our development starting in the late 1970s, accelerating through the1980s and 1990s, and continuing into the 2000s. During this period it was government policy that all data and information had an immediate intrinsic value and this must be paid by the “end user”. The result of this was the drastic drop in the use of many data sources, and the trend for policy and decision making to become “data free zones”. 

When GeoNet began operation in 2001, the concept of Open Data was very unusual in New Zealand. Therefore, the fact that it was included as a requirement in the contract between the Earthquake Commission (EQC) and GNS Science was revolutionary, and one of several ground-breaking features of the arrangements between the two organisations. EQC insisting on an Open Data policy is yet another demonstration of how visionary and forward thinking the management and Board of EQC were at the time (and continue to be) with their support of  GeoNet and its part in New Zealand's geological hazards mitigation strategy. What if the Canterbury earthquakes had occurred before the establishment of GeoNet when there was only one real-time seismic sensor in the whole of Canterbury?

There has been a huge change in the last decade, and now most institutions in New Zealand (and internationally) accept the value proposition that Open Data is important for the advancement of science and the overall goals of New Zealand society (and GeoNet now has over 600 sensor network sites). We live in a beautiful but geologically active land. In our naturally active environment, the GeoNet Open Data policy has quickly led to a better understanding of the perils we face and the mitigation measures required.

For example, following the destructive Christchurch Earthquake of 22 February 2011 the openly available GeoNet strong ground shaking data was crucial to the understanding of the levels of damage and what changes were needed in the building codes before reconstruction began.The observed level of damage was greater than expected from a moderate sized earthquake, but the data were available to demonstrate the very high energy (maximum shaking levels over twice the force of gravity) compared to the magnitude. Detailed earthquake source modelling was possible showing that the fault ruptured up to a shallow depth beneath the Christchurch central business district. GeoNet data are central to the publication of four Canterbury special issues of scientific journals, and features in numerous scientific papers and presentations at conferences, enriching our understanding of this important earthquake sequence.

So Open Data it is, and we are pleased that after 12 years the significance of the GeoNet Open Data policy is publically recognised - thanks to the New Zealand Open Source Awards!


Sunday, October 14, 2012

GeoNet and Tsunami - Part One


One of GeoNet’s roles is as science advisers to the Ministry of Civil Defence & Emergency Management (MCDEM) on tsunami response. Currently this is mainly confined to regional and distant source tsunami caused by earthquakes. So how do we carry out our role?

There are three major aspects of the role – data and information, expert advice and warning systems and international engagement. I will outline each of these in turn – in this blog I will just concentrate on the tsunami (sea level) gauge network.

As a part of GeoNet we operated a tsunami gauge network of 17 sites around New Zealand and on offshore islands. These sites have twin pressure sensors in the ocean to record sea height change. The network is operated in partnership with Land Information New Zealand (LINZ) with the GeoNet Earthquake Commission (EQC) contribution supporting the data communications and processing. All the data is made available to the international data centres, particularly the Pacific Tsunami Warning Centre, (PTWC) in Hawaii, as well as being available from the GeoNet website.

A question we are often asked is: do these sites provide warning? And the answer (I am a scientist after all!) is yes and no. Yes, the gauges on offshore islands will provide an hour or two warning of a tsunami “surges” heading for mainland New Zealand, and ones on the mainland coast will provide some warning for other parts of New Zealand. But a gauge very close to you will be no help to you for warning. Tsunami warning is very international so we rely on information from other countries gauges, and other countries rely on our gauges – particularly our cousins across the ditch (for non-Australians or New Zealanders, that is the Tasman Sea) who may be threatened by a large earthquake at the bottom of New Zealand’s South Island.

Another really important use for these tsunami gauges is the calibration of tsunami forecast models. Since the Indian Ocean Tsunami on Boxing Day 2004 there has been huge progress with models that forecast the likely impacts from earthquake caused tsunami once accurate information earthquake is available. This is particularly true for ocean basin wide tsunami, where the tsunami waves may travel for many hours before being a threat on a distant shore. If the likely impacts can be forecast in advance then effective evacuation is possible without the economic losses of over evacuation or the issues caused if people are asked too often to evacuate but no tsunami occurs (the “cry wolf” affect).

Figure 1: Recordings of the Japanese Tsunami around the New Zealand Coast on the LINZ GeoNet Tsunami Gauge sites. Note the largest surges at Gisborne and the Chatham Islands are four to six hours after the first arrivals.
Recent Pacific Ocean basin wide tsunami have provide a rich data source for refining tsunami models. For example, the Japanese tsunami of 11 March 2011 was well recorded around the New Zealand coast (see Figure 1) with surge heights of around a metre in places. These measured values were very close to the forecast levels and increase our confidence that we can effectively warn New Zealand communities without closing the whole New Zealand coast. Figure 1 also demonstrates a really important observation – tsunami surges from distant tsunami just keep coming. In Gisborne and the Chatham Islands the largest surges occurred many hours after the first arrivals. If you cannot see the shark any more it may be safe to go back in the water (see Jaws if you don't understand the reference), but with tsunami take extra care for many hours after you see the first rise and fall of the sea.

In my next tsunami blog I will go into more detail about how we use the data and information and expert advice to advise on likely tsunami impacts.

Monday, September 17, 2012

Felt Intensity – What You Feel is What You Get!

How do we size an earthquake?

A few earthquakes over the last few months have got me thinking about how we talk about earthquake size. In the western world we are quite focused on magnitude, but that only gives a starting point. I have already bored you enough about earthquake magnitude in a few previous blogs (see What’s the Magnitude?; Deep Earthquakes and Magnitudes; and Deep Earthquakes and Magnitude – Again!) – but to recap, an earthquake magnitude is an estimate of the true size of an earthquake independent of the observer (or where the observer is). The magnitude is only the start of the story if you want to understand the likely impacts of an earthquake. Not all earthquakes are created equal; some are more energetic than others even if they have the same magnitude. Some direct shaking energy towards where people live, and where you are compared to the earthquake source is very important. All this leads to the idea of shaking intensity – a mapping of the levels of shaking caused by an earthquake rather than a single number like magnitude.


Modified Mercalli Shaking Intensity
  
If you want to characterise how you feel an earthquake, then felt intensity is what you are after. This is a measure of the shaking where you are, and is given (at least in New Zealand) by the Modified Mercalli (MM) scale which covers the range from not felt (MM 1: Imperceptible) to complete destruction (MM 12: Completely devastating). Obviously an earthquake’s impact and the level of damage it causes are related to the intensity. The MM value at a particular place depends on the distance from the earthquake, its size and depth, the kind of rocks between you and the source and material you or the building you are in rests on.

ShakeMap (or where did the map go?)

On the old GeoNet website we had a display on the front page based on the shaking at each recording station (Figure 1). Although this gave a good indication of the where maximum shaking levels were being recorded by our instruments (and I know some of you want it back!), it could be biased by instrument issues and was often misinterpreted. So it was good for a quick look, but not really very useful for characterising the potential damage in detail.
Figure 1: The "ShakeNZ" plot for the Christchurch  Earthquake  of 22 February 2011. This map shows the shaking  levels as squares around the sensor sites which change colour and get larger as the shaking level increases.
We are working towards having a ShakeMap (as developed by the United States Geological Survey, see the USGS Shakemap site) available for larger earthquakes which will indicate the distribution of shaking (see Figure 2 for an example). This map will be produced within a few minutes of an earthquake occurring and be based on data from the sensor sites and a knowledge of how the earthquake waves travel through the Earth (tailored for New Zealand conditions). The map will show MM intensity but we will also be able to provide information in forms that are suitable for use by engineers interested in the level of shaking experienced by buildings or other structures in the region. This can include shaking accelerations at different periods of oscillation – different size structures are more susceptible to different shaking oscillations caused by earthquakes.

Current planning should see ShakeMap on the new GeoNet website within the next few months.

Figure 2: An example ShakeMap for the Christchurch Earthquake of 22 February 2011. This is  an example of what the ShakeMap on the new GeoNet website may look like.
So what about shaking duration?

This is a hard one as the perceived duration will depend both on the size of the earthquake and where you are (a bit like intensity) but is also very dependent on the near surface structure under your feet. For example, if you live in a valley the shaking waves will “bounce around” in the valley and the shaking will go on for much longer than if you were on a hard rock site. We can estimate how long the fault takes to rupture (by studying the earthquake waves recorded on our instruments), but how long the Earth shakes depends on the size and distance, and how many ways the earthquake waves reach you (some waves “bounce” around in the Earth so the shaking goes on much longer than the fault break time). For these reasons we do not usually use duration as a measure of earthquake size.

To put this in terms of recent experience the fault-break of the Christchurch Earthquake (22 February 2011) was over in just a few seconds, but the shaking went on longer because of the near-surface structure under the city. But the total duration in areas of maximum damage was only around 10 - 15 seconds. Compare that to a possible Alpine Fault earthquake much further away from Christchurch where the shaking intensity would be much less in the city (in fact even much less than the Darfield Earthquake of 4 September 2010) but the shaking would go on for minutes. Duration is not a good indication of likely earthquake impacts. 

Sunday, September 9, 2012

GeoNet – Past, Present and Future


GeoNet needs your input …. But first some background:

Why do we need GeoNet?

New Zealanders live on the edge - astride the Pacific-Australia plate boundary, a part of the Pacific “Ring of Fire”. The level of earthquake hazard in New Zealand is similar to that of California and most communities have some exposure to this hazard. Additionally there is a significant volcanic hazard, both from the cone and caldera volcanoes of the central North Island and the volcanic field underlying its largest city, Auckland. Throughout New Zealand, landslides may be triggered by extreme weather or earthquakes, and the coastal areas are prone to tsunami, both from distant and local sources.

The case for GeoNet

In 2000 at the invitation of the New Zealand Earthquake Commission (EQC), GNS Science proposed the establishment of GeoNet, a geological hazards monitoring system. GeoNet would facilitate the detection, data gathering and rapid response to New Zealand earthquakes, volcanic activity, landslides, tsunami and the slow deformation that precedes or follows large earthquakes. This followed more than five years of equipment trials, capability reviews and widening concern about national geophysical infrastructure, the purpose and renewal of which had been largely overlooked during a major restructuring of the Government science sector in the early 1990s.

EQC launched GeoNet in 2001 through its research and education programme. In partnership with Land Information New Zealand (LINZ) and the Department of Conservation, EQC’s long-term support and direction of GeoNet has facilitated the creation of world-class capabilities.  GeoNet now has sensor networks throughout New Zealand (over 550 sites), distributed data collection, processing and distribution capabilities and a programme of continual improvement. In 2009, EQC renewed its commitment to GeoNet for a further decade, with the strategic focus shifting from delivery of minimum geographic coverage, to more sophisticated management of data and information to meet evolving user needs.

The GeoNet Review

Every four years an international strategic review of GeoNet is conducted to ensure its performance and map future directions and the next one will take place in late October this year. Earlier reviews took place in 2004 and 2008.

Since the 2008 review, the earthquakes in Canterbury have provided an extreme test of all GeoNet systems.  It is therefore timely to consider how GeoNet might be enhanced or extended to maximise the value of investment in the system.  This contemplates wider use of the collected information beyond the core geological hazards area.  For example, the current networks could be adapted to support country-wide, high-accuracy real-time positioning applications for many different sectors.

GeoNet Needs Your Input ….

If you regularly use GeoNet data and information for your work or analysis, or have used GeoNet data in a major project, we want to hear about it.  For example, we are aware that many people have used GeoNet strong-motion data in the analysis of the impacts of the Canterbury earthquakes and in published research papers, but the source of the data has not always been attributed, so it is hard for us to identify all related work without your help.

We are particularly keen to hear how GeoNet might be significantly improved in future. Please submit brief (maximum one page) summaries on either or both of these topics as soon as possible, not later than  21 September to geonet-review@gns.cri.nz.Your experience and ideas will inform the planning and direction for the next few years, so please help make a difference.